 |
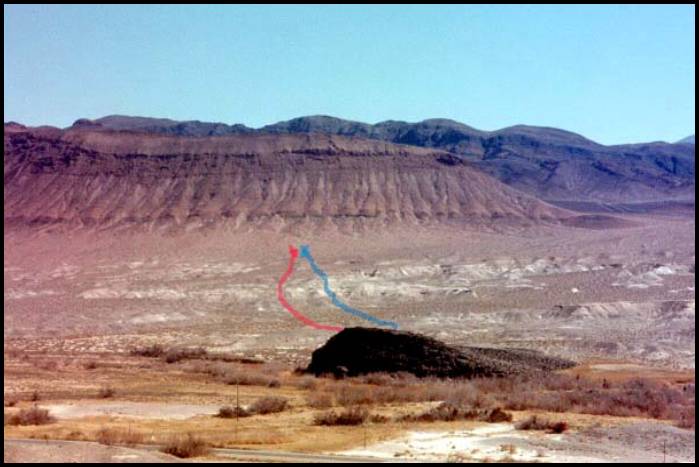
Approximate profile lines.
|
|
|
|
|
|
|
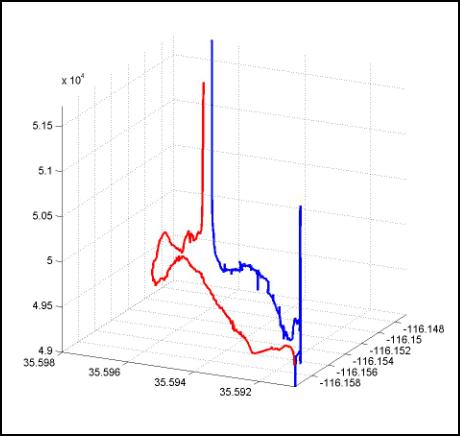
Looking NE, along the
profiles. In all the pictures: Horizontal axes are longitudes and latitudes
of the profiles. Vertical axis represents magnitude of the magnetic field in
nT. The blue line is the profile surveyed first. It ends at the SW tip of the
profile where the basalt
outcrop starts. The dying instrument battery caused the peak at the end
of the profile. The red line represents the second profile, that goes
from NE all the way back to the base
station (two peaks). The steel casing in a drill hole brings out two NE most
peaks. |
|
|
|
|
|
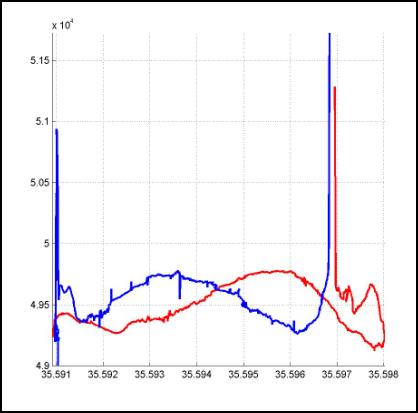
The profiles projected on
the latitude axis. Both projections (this one and one on the right) do not go
along the profiles. Interpretation of theses figures, for that reason, could
be more difficult. Nevertheless, both profiles show a bump in the total
magnetic field as if it was caused by a SE-NW stretching source. |
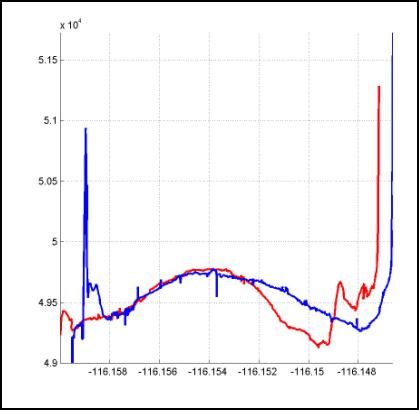
Profiles
projected on the longitude axis. |
|
|
|
|
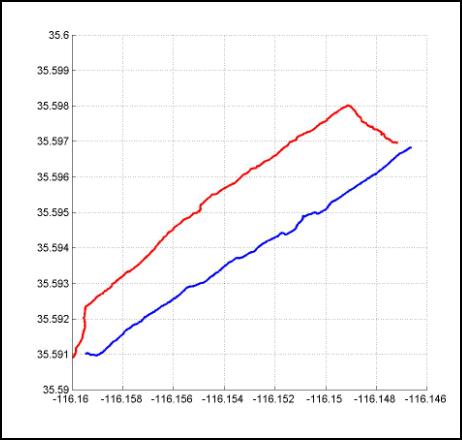
The trajectory
of the survey. Two-dimensional projection of the profiles. A look from above. |
|
|
|
|
|
Does not hurt to
rotate it a bit more, doesn’t it? |
|
By Ivan Rabak & Marcelo Santillan