
Noise Images
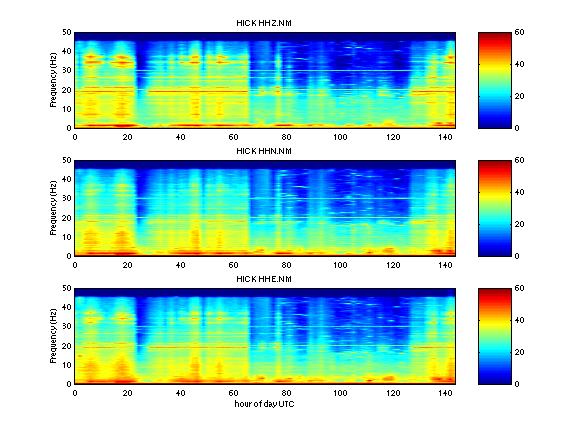
Listed below are links to noise images. 10 minute data slices were obtained every two hours beginning March 24, 2000, 00:00 UTC and ending March 29, 2000, 22:00 UTC. Power spectral density was then calculated on each slice using Welch's method with 2048 point hann tapers and 50% overlap. Each of these were then plotted in db (10*log10(psd)). Freqency is shown vertically, time in hours horizontally, and color is more or less power with respect to counts.
Data gaps and instrument repsonse have not been accounted for.