|
Master’s Thesis Proposal By Ivan Rabak
Memphis, April 2nd, 2001 |
|||||||||||||||||||||||||||||||||||
|
ABSTRACT Almost
20 years after a remarkable swarm of more than 30,000 microearthquakes, a new
swarm has revisited the same central Arkansas region, approximately 50 km
north of Little Rock. A “main shock” on May 4, 2001 of magnitude M = 4.4 was
followed by a large number of “aftershocks” in a small crustal volume. About
2,500 events were recorded above noise level on a continuously operating
broadband seismograph deployed in the epicentral area for about 2 months. Preliminary locations of aftershocks from the portable
network together with the locations based on data from regional networks lead
us to conclude that both swarms (2001 and 1982) occupy virtually the same
crustal volume. The 2001 swarm raises the possibility to answer some of
the still-unanswered questions raised by studies of the first Enola sequence.
If the swarms represent the release of regional tectonic stress why are they
confined to such a small crustal volume? What is the configuration of faults
causing these earthquakes and how are they related to regional structure and
stress patterns? What is the significance of the observed swarm-like
character of occurrence, or in other words, the lack of a mainshock-aftershock
scheme with Omori temporal decay? What is the relationship of the mainshock
with the subsequent swarm? We hope to resolve these questions by obtaining
accurate locations for the 2001 swarm events, through high-precision relative
relocations using the HYPODD algorithm. Accurate focal mechanisms will be determined using waveform
modeling for the mainshock and later swarm events and will be incorporated
into analysis of swarm clusters determined using the relative location
algorithm. INTRODUCTION On
May 4, 2001, central Arkansas experienced an M=4.4 earthquake. This
“mainshock” was followed by a surprisingly large number of small
earthquakes. We recorded about 2500
above the ambient noise level on a continuously recording broadband
seismograph deployed in the epicentral area for about 2 months. The occurrence rate of “aftershocks” does
not appear to have an Omori temporal decay, but fluctuates greatly with
time. We also deployed a temporary
network of several analog and six digital portable 6-channel (3
accelerometer, 3 short-period seismometer) seismographs that operated in
triggered mode for about 2 months.
The triggered network recorded about 35 locatable earthquakes. The mainshock, and several large
aftershocks were well recorded on about 90 stations of the CNMSN network,
including about 10 broadband seismographs within the Mississippi
embayment. The location of the
mainshock from regional networks, and preliminary locations of aftershocks
from our portable network are closely coincident with the location of a
remarkable swarm of earthquakes that took place in the early 1980s. The earlier Enola swarm (Enola-1) produced
some 30,000 earthquakes in a 3-year period. |
|||||||||||||||||||||||||||||||||||
|
|
|||||||||||||||||||||||||||||||||||
|
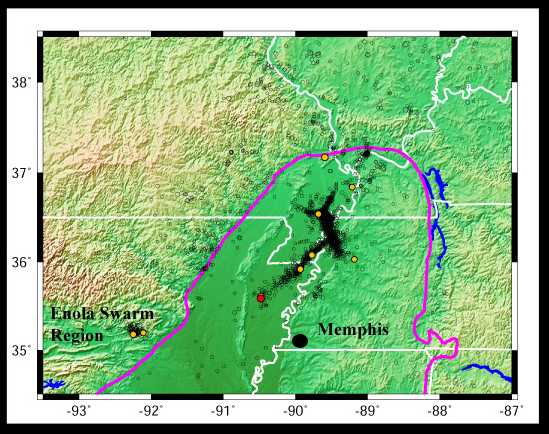
Figure 1. The Mississippi Embayment topographic map. Circles represent earthquake magnitudes recorded on CERI networks up to 1996. The red circles are magnitudes greater than 5, yellow between 4 and 5, and open black circles show earthquakes of magnitude less than 4. The Enola swarm region is about 200 km SW from the New Madrid Seismic Zone. |
|||||||||||||||||||||||||||||||||||
|
The swarms took place in the Arkoma Basin, north of the frontal Ouachita transition zone. Tectonically, this region differs from the rift structure of the New Madrid seismic zone. A series of folds characterizes the greater Enola swarm region. About 80 m.y. ago Arkansas was a volcanically active region. However, it is unlikely that the swarm activity is due to a recent episode of igneous activity even though it is similar to swarm-like seismicity in Matsushiro, Japan (Johnston, 1982). The area contains east-west trending folds and faults caused by north-south compression. However, the present day compressional stress field is oriented ~ ENE (Zoback and Zoback, 1980). Paleozoic sandstones and carbonates occur to a depth of ~ 6 km where the Precambrian basement starts. North of the swarm area the region is dominated by south dipping normal faults. The region south of the swarm, however, is dominated by thrust faults, forming a fold-and-thrust belt. Close to the surface the faults are replaced by many anticlines. These faults were formed during the middle and late Pennsylvanian time. Thrust faulting is thought to be the last tectonism in the area overprinting the preexisting normal faults (VanArsdale and Schweig, 1990) . |
|||||||||||||||||||||||||||||||||||
|
|
|||||||||||||||||||||||||||||||||||
|
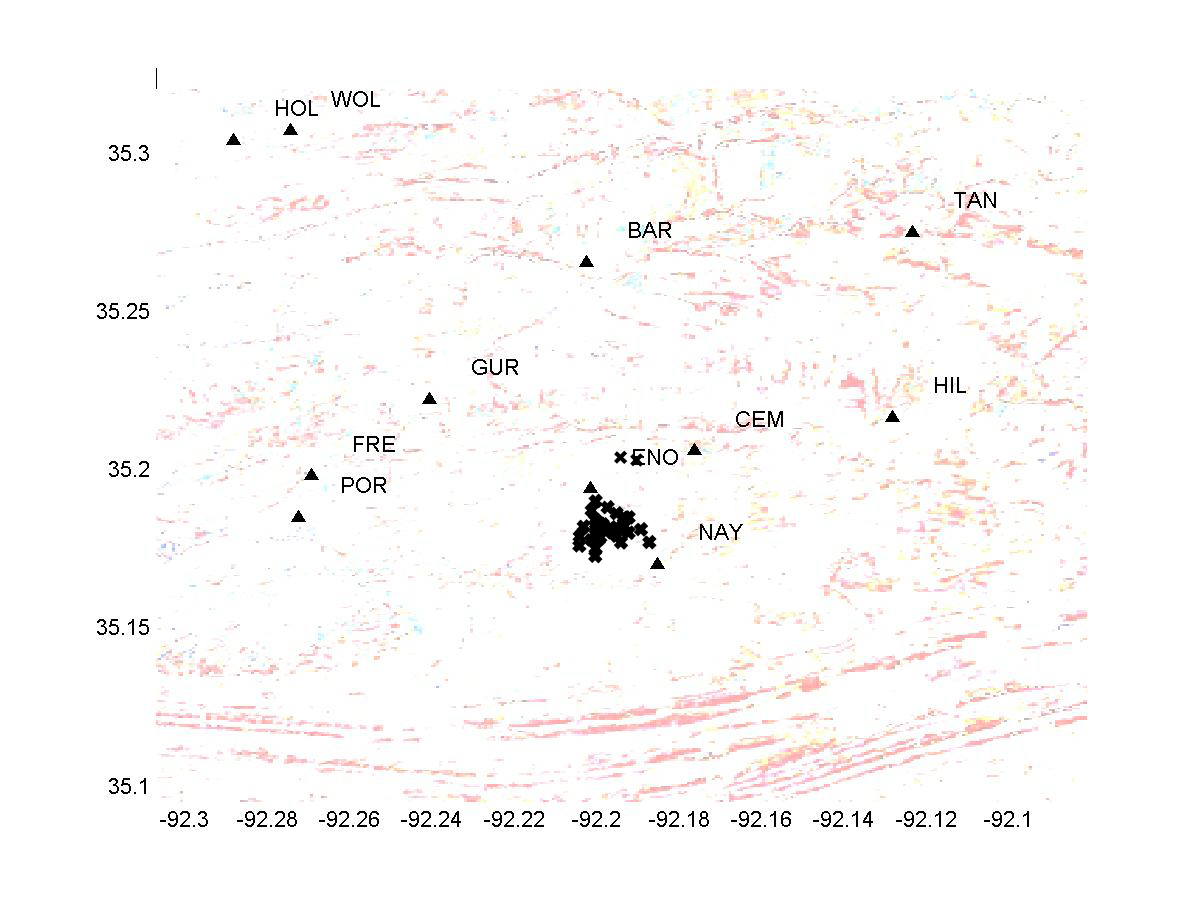
Figure 2. Individual locations of the Enola 2001 swarm. The earthquakes are highly clustered occupying an area of about 5 x 5 km. Vertically they range (not shown) between 5 and 8 km. Triangles are stations of the portable network. Fold-and-thrust belt is outlined at the bottom of the figure (folded red parallel lines). |
|||||||||||||||||||||||||||||||||||
|
Based on changes in the vp/vs ratio within a day and the high number of earthquakes in a small volume Chiu et al. (1984) proposed that the rock in the swarm area must be highly fractured. Interpretation of seismic reflection data taken over the swarm area also supports that hypothesis (Schweig et al., 1991). Furthermore, application of the joint hypocentral determination (JHD) technique (Pujol et al., 1989) showed up to 15% lower seismic velocities in the hypocentral volume then in the surrounding rocks. The documented seismic history of the swarm region preceding the 1982 events is almost non-existent. There are some felt-reports indicating that same area experienced earthquakes in 1962-63. Periodicity, confined source volume, low velocity in the swarm area as compared to surrounding crust, some 20 cm of uplift in the swarm area for the last 25 years, a highly fractured hypocenter zone, lack of mainshock-aftershock scheme, episodic bursts of seismicity, spatially isolated seismic zone, no apparently active faults, apparently tectonic quiet broader region are the general features of the Enola earthquake swarms. Due to the approximate dimensions of the swarms, no single event of magnitude greater than 5 is expected (Nuttli, 1983). |
|||||||||||||||||||||||||||||||||||
|
|
|||||||||||||||||||||||||||||||||||
|
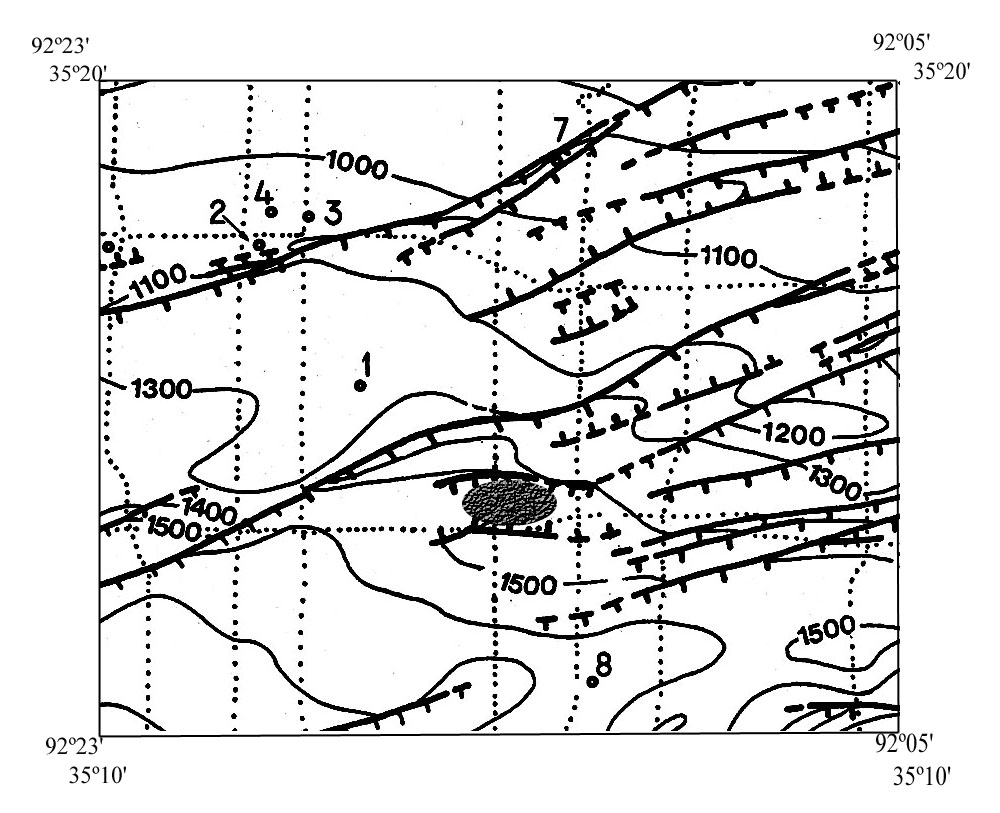
Figure 3. Faults around the swarm area (dark ellipse). Bold lines are normal faults, teeth on downthrown side. Dotted lines are seismic reflection lines. Contour lines in msec. are depths of the Boone formation |
|||||||||||||||||||||||||||||||||||
|
IMPORTANCE OF THE PROJECT The Enola swarms took place in an intraplate setting. I want to investigate possible causes of these intraplate earthquakes since the causes of intraplate earthquakes are not scientifically understood. The Enola area lies tectonically and geologically outside of the New Madrid seismic zone but a causal relationship between the seismic zones cannot be completely ruled out. Perhaps seismicity in the Enola area is an indicator for changes in the regional stress field. Basic data analysis on temporal/spatial distribution of Enola seismicity is needed; determination of basic parameters about faulting is essential in this intraplate region to understand possible seismic zones and regional stress conditions. I will be using new techniques for studying the data that could be used for studying New Madrid seismic zone earthquakes from network data. In addition, numerous MatLab routines will be written that can later be incorporated in a quick earthquake location and preliminary data analysis software package for the portable CERI aftershock network. METHOD OF APPROACH My hypothesis is that source volume of the swarms must have some specific physical attributes that isolate the swarm region from the rest of the seismically quiescence area. To test this hypothesis, I need to determine all relevant physical parameters of faulting during the swarm. Precise locations are needed to resolve fault patterns. Precise fault mechanisms are needed to resolve fault planes and structural style. This structural configuration can then be compared to independent geological data to examine how it agrees or differs from the regional framework. Clues to how the faults interact may be obtained from a detailed spatial/temporal analysis of the resulting source parameters. The 2001 earthquake swarm data will be processed and interpreted separately from the seismic data obtained for the 1982 swarm. An outline of similarities and differences between the two swarms (1982 and 2001) and possible explanations will also be given. About 2500 events were recorded above noise level on a continuously operating broadband seismograph deployed in the epicentral area for about 2 months (GUR station, Figure 2). In addition to the broadband instrument several analog and six digital portable 6-channel event-triggered seismographs were also deployed in the epicentral area. Seismic data from CERI network is also available as well as broadband data from IRIS. These data sets will be the principal objects of study in this work. I will be analyzing phase arrival times and P and S waveforms to constrain event locations and source parameters. |
|||||||||||||||||||||||||||||||||||
|
Table 1. Left is the velocity model used for individual earthquake locations of the 2001 swarm. The same model differs from the one (right) derived from seismic reflection profiles (Chiu et al. 1984) |
|||||||||||||||||||||||||||||||||||
|
|||||||||||||||||||||||||||||||||||
|
Some preliminary first
motion focal mechanisms (Enola 2001) have been calculated showing
predominantly strike-slip faulting. More precise focal mechanism calculations
will show how much these focal mechanisms are consistent with the regional
stress regime. A lack of consistency would suggest that the swarm has some
kind of an internal earthquake nucleation generator. The strikes of the
faults in the swarm region seem to be mostly parallel with the maximum
compressive stress axis not allowing accumulation of shear stress. Precise
earthquake locations and finding appropriate faulting orientation for strike
slip motion is one of the most important tasks in this project. The Enola earthquake swarms are very peculiar seismic events and in the light of 2001 earthquake sequence they deserve to be studied again focusing on recently acquired high-quality seismic data. WORK PLAN 1) Seismicity
of the 2001 Enola Swarm First, a detailed study of the daily histogram of seismicity of the Enola 2001 earthquake swarm needs to be completed. Preliminary results show episodes of increased seismicity. The classic mainshock-aftershock scheme is missing here but these bursts in seismicity might suggest just the opposite: there is a big magnitude event followed by many small ones; and then, a big one again and so on. The broadband site was almost continually operational (Figure 4.) for the entire portable network lifetime so I choose to use the data from that site to estimate daily seismic activity. This task would last up to the end of May 2002. |
|||||||||||||||||||||||||||||||||||
|
|
|||||||||||||||||||||||||||||||||||
|
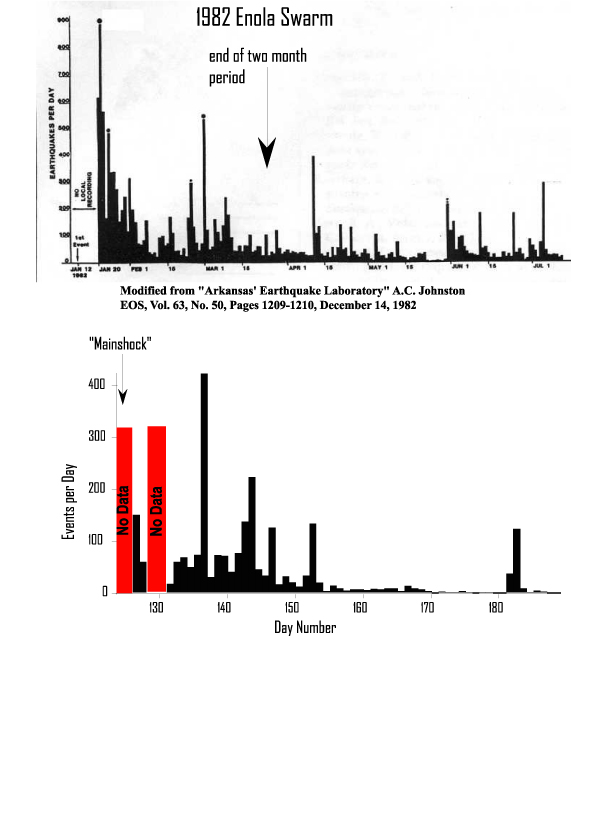
Figure 4. Histogram of daily seismicity for the 1982 (upper) and 2001 (lower) Enola earthquake swarms. Bursts of seismic activity characterize both swarms with the approximate the same period |
|||||||||||||||||||||||||||||||||||
|
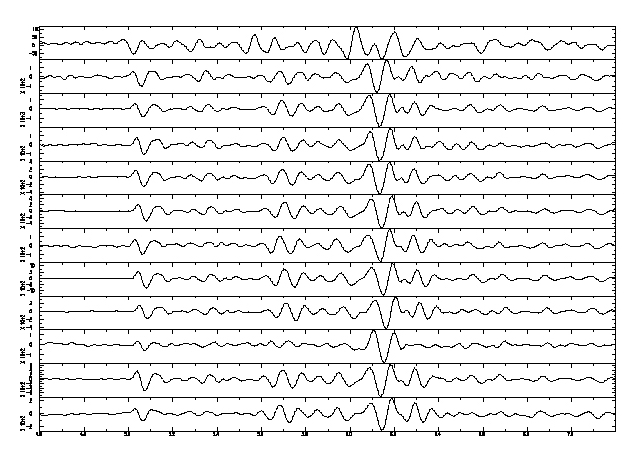
2) Relative Event Relocation It is necessary to do individual locations again because of the generic velocity model used instead of the more specific one derived using the reflection data in the swarm area (Table 1). There are about 100 earthquakes from the 2001 swarm that have been recorded on at least 4 stations. These 100 earthquakes will be relocated using the HYPODD algorithm (Waldhauser and Ellsworth, 2000) in order to determine a possible fault zone and to identify possible patterns in hypocenter clustering. It is necessary to cross-correlate events using P and S waves to obtain relative time differences between them and use that as an input parameter for HYPODD. Cross-correlation will be used to identify other earthquakes with similar waveforms recorded on the broadband site and to form event clusters (Figure 5). This task would last up to mid July 2002.
3) Source Mechanism Studies Waveform modeling techniques will be used to determine focal mechanisms. First motion focal mechanism additionally constrained with S - and P – wave amplitudes will show whether they are consistent with the regional stress regime. This assumes that the earthquakes have double-couple focal mechanism. |
|||||||||||||||||||||||||||||||||||
|
|
|||||||||||||||||||||||||||||||||||
|
Figure 5. Similar earthquake waveforms recorded on July 1st, the broadband site within 2.5 hours. These earthquakes seem to have the same source characteristics and ray paths. It is highly likely that they originate from virtually the same spot. This waveform similarity makes cross-correlation a viable method. Between P – and S – phase arrivals, there seems to be a phase conversion. We should expect to find an interface within the upper 7 km. Because of the relatively small portable network aperture almost all the earthquakes come directly from beneath the stations. |
|||||||||||||||||||||||||||||||||||
|
In addition, I will perform moment tensor inversion of the P and S wave from the data to investigate possible non-double couple component of event mechanisms. For example, significant isotropic component could indicate opening or closing cracks in the hypocentral volume. This task would last up to the end of August 2002. 4.) Data Synthesis I should have the first draft of my thesis by mid September 2002. I would defend my thesis in mid October. By November 15 the thesis should be defended and sent to Graduate School. November 27 is the last day to sent the thesis to Graduate School for binding. |
|||||||||||||||||||||||||||||||||||
|
REFERENCES Chiu, J-M., A.C. Johnson, A. Metzger, L. Haar, and J. Fletcher (1984). Analysis of analog and digital records of the 1982 Arkansas earthquake swarm, BSSA 74, 1721-1742. Haar, L.C., J.B. Fletcher, and C.S. Mueller (1984). The 1982 Enola, Arkansas, swarm and scaling of ground motion in the eastern United States, BSSA 74, 2463-2482. Johnston, A.C. (1982). Arkansas’ earthquake Laboratory, EOS 63, 1209-1210. Lees, J.M. (1998). Multiplet analysis at Cosco geothermal, BSSA 88, 1127-1143. McFarland,J.D (2001). May 2001 Faulkner County Earthquakes, Arkansas Geological Commission. Nuttli, O.W. (1983). Average seismic source parameter relations for mid-plate earthquakes, BSSA 73, 519-535. Pujol, J., J-M. Chiu, A.C. Johnson, and B-H. Chin (1989). On the relocation of earthquake clusters. A case history: The Arkansas earthquake swarm, BSSA 79, 1846-1862. Saikia C.K., and R.B. Herrmann (1986). Moment-tensor solutions for three 1982 Arkansas swarm earthquakes by waveform modeling, BSSA 76, 709-723. Schweig, E.S. III, R.B. VanArsdale, and R.K. Burroughs (1991). Subsurface structure in the vicinity of an interplate earthquake swarm, central Arkansas, Tectonophysic 186, 107-114. VanArsdale,
R.B., and E.S. Schweig III (1990). Subsurface structure of the eastern Arkoma
basin, Am. Assoc. Pet. Geol. Bull. 74, 1030-1037. Waldhauser, F. and W.L. Ellsworth (2000). A double-difference earthquake location algorithm: Method and application to the northern Hayward fault, California, BSSA 90, 1353-1368. Zoback, M.L. and Zoback, M.D. (1980). Tectonics stress field of the continental United States, Geol. Soc. of Am., Mem., 172: 523-540. |