Investment Policy Statement
for
Community Foundation of Southern Indiana
Adopted by the Board of Directors
on November 15, 2005
Revised September 26, 2008
Table of Contents
Executive Summary………………………………… Page 1
Purpose ………………………………………………Page 2
Background…………………………………………..Page 2
• Key Information
Statement of Objectives……………………………....Page 4
Guidelines and Investment Policy……………………Page 4
- Time Horizon
- Spending Rate Policy
- Risk Tolerances
- Performance Expectations
- Asset Allocation Constraints
- Rebalancing of Strategic Allocation
Securities Guidelines……………………………….. Page 7
- Domestic Equities
- Domestic Fixed Income
- International Equities
- International Fixed Income
- Cash / Cash Equivalents
Selection of Money Managers……………………….. Page 9
Control Procedures…………………………………...Page 9
- Duties and Responsibilities of the Money Managers
- Brokerage Policy
- Monitoring of Money Managers
| Executive Summary | |
|---|---|
| Type of Investor: | Community Foundation |
| Current Assets: | $18.0 Million |
| Planning Time Horizon: | Greater than ten years |
| Expected Long-Term Return: | 8.65 percent (5.15 percent over CPI) |
| Risk Tolerance: | High/Moderate, losses not to exceed –14.2 percent per year, |
| based on a statistical confidence level of 90 percent | |
Asset Allocation
Lower Strategic Upper Asset Class Limit Allocation Limit
Domestic large capitalization equities: Value 11% 13% 21% Core 7% 10% 17%
Domestic mid-capitalization equities Value 7% 12% 17% Core 1% 6% 11%
Domestic small capitalization equities: Growth 1% 5% 10%
Value 4% 9% 14% International equities 5% 15% 20% Fixed income:
Active Intermediate Duration 10% 15% 20% Treasury Inflation Protected 5% 10% 15% Active Intermediate International 1% 5% 10%
Evaluation Benchmark:
Total Return to exceed performance of the median of the Morningstar Moderate Allocation fund universe and above a customized index comprised of market indices weighted by the strategic asset allocation of the Foundation as follows:
Weight Benchmark
Domestic large capitalization Value 13% Russell 1000 Value Domestic large capitalization Core 10% Russell 1000 Domestic mid-capitalization Value 12% Russell Mid Value Domestic mid-capitalization Core 6% Russell Mid Domestic small capitalization Growth 5% Russell 2000 Growth Domestic small capitalization Value 9% Russell 2000 Value International equities 15% MSCI-EAFE Active Intermediate Duration 15% Lehman Aggregate Treasury Inflation Protected 10% Lehman LT Government Active Intermediate International 5% Citi-Non$ World Gov
Purpose
The purpose of this investment policy statement (IPS) is to assist the Investment Committee (Committee) in effectively supervising, monitoring, and evaluating the investment of the Community Foundation of Southern Indiana’s permanent assets (investments covered by this policy statement). The Foundation’s investment program is defined in the various sections of the IPS by:
- Stating in a written document the Committee’s attitudes, expectations, objectives, and guidelines for the investment of the Foundation’s assets
- Setting forth an investment structure for managing all investable Foundation assets. This structure includes various asset classes, investment management styles, asset allocations, and acceptable ranges that, in total, are expected to produce a sufficient level of overall diversification and total investment return over the long term.
- Providing guidelines for each investment portfolio that control the level of overall risk and liquidity assumed in that portfolio, so that all Foundation assets are managed in accordance with stated objectives.
- Encouraging effective communications between the Committee, the investment consultant (if any), and the money managers.
- Establishing a formalized criteria to monitor, evaluate, and compare the performance results achieved by the money managers on a regular basis.
- Complying with all, fiduciary, prudence, and due diligence requirements that experienced investment professionals would utilize, and with all applicable laws, rules, and regulations from various, local, state, federal, and international political entities that may impact Foundation assets.
This IPS has been formulated based on consideration by the Committee of the financial implications of a wide range of policies, and describes the prudent investment process that the Committee deems appropriate.
Background
The Community Foundation of Southern Indiana, (CFSI) is a non-profit charitable foundation that accepts money from individuals and organizations and holds it in trust, using the interest in part to fund community organizations and scholarships.
It is a permanent resource of funds to help meet community needs today and provide for the changing needs of future generations by encouraging philanthropic leadership and providing flexible endowment opportunities.
In addition, CFSI provides support services to non-profits and the community at large through seminars, special events, and recognitions.
Key Information:
Foundation IRS Tax ID: 35-1827813 Executive Director / CEO: Mike Waiz, Attorney Key Foundation Fiduciaries:
Rita Shourds, Chairperson
Leslie Robertson, Vice Chairperson
Kyle Ridout, Secretary
Butch Shaw, Treasurer
Don Day, Immediate Past Chairperson, Investment Committee
Chairperson Custodian: T D Ameritrade Investment Managers: Barclays Global (I-shares) Investment Consultant: (none – Investment Committee) Legal Counsel: Leslie Vidra, Attorney Accountant: McCauley Nicolas & Co LLC
Statement of Objectives
The objectives of the Foundation have been established in conjunction with a comprehensive review of the current and projected financial requirements. The objectives are:
Objective: Follow a spending policy based on total return.
Note: A total return based policy allows the committee 1.) to map out a long-term investment strategy and 2.) employ modern investment management techniques.
Objective: Maintain the purchasing power of the fund.
Note: The objective is to maintain the level of services and programs in relation to average cost increases. This requires establishing an equilibrium spending rate of 5.65 percent. (4% for programs and 1.65% for administrative, it is anticipated as the asset base increases the percentage of assets demand for administrative expenses will decline)
Objective: Apply a smoothing rule to mitigate the effects of short-term market volatility on spending.
Note: Since investment returns may vary dramatically from year to year, spending a constant percent of the Foundation’s market value would play havoc with spending amounts. Therefore, the following smoothing rule will be applied:
• Moving average. The equilibrium spending rate will be applied to an average of the past three years (12 quarterly measurements) of the Foundation’s market values.
Objective: Maintain a constant funding support ratio.
Note: The desire of the investment committee is to maintain the level of programs and services currently provided. This objective can only be met if sufficient total return is reinvested and sufficient new funds added to keep pace with cost increases and program expansions.
Guidelines and Investment Policy
Time Horizon
The investment guidelines are based on an investment horizon of greater than ten years, so interim fluctuations should be viewed with appropriate perspective. Similarly, the Foundation’s strategic asset allocation is based on this long-term perspective.
Short-term liquidity requirements to maintain sufficient liquid reserves to provide for the payment of spending rate allocations will be held separately outside of the accounts for the strategic allocation. The Committee’s Chair will notify the investment managers well in advance of the withdraw orders to allow sufficient time to build up necessary liquid reserves outside of the strategic allocation.
Risk Tolerances
The Committee recognizes the difficulty of achieving the Foundation’s investment objectives in light of the uncertainties and complexities of contemporary investment markets. The Committee also recognizes that some risk must be assumed to achieve the Foundation’s long-term investment objectives.
In establishing the risk tolerances of the IPS, the ability to withstand short and intermediate term variability was considered. These factors were:
- Foundation believes that it should be able to achieve above-average contribution growth during the next several years.
- The Foundation’s strong financial condition enables it to adopt a long-term investment objective
- The life of a community foundation is viewed in perpetuity, therefore suggesting an above average risk tolerance
- Liquidity and spending rate requirements are based on a smoothing methodology, which implies that a higher risk profile is acceptable.
In summary, the Foundation’s prospects, current financial position, organizational lifespan, and spending rate policy suggest collectively that the Foundation can tolerate some interim fluctuations in market value and rates of return in order to achieve long-term objectives.
Performance Expectations
The desired investment objective is a long-term rate of return on assets that is at least 8.65 percent, which is 5.65 percent greater than the anticipated rate of inflation as measured by the Consumer Price Index (CPI). The target rate of return for the Foundation has been based on the assumption that future returns will approximate the long-term rates of return experienced for each asset class in the IPS.
The Committee realizes that market performance varies and that a 8.65 percent rate of return may not be meaningful during some periods. Accordingly, relative performance benchmarks for the mangers are set forth in the “Control Procedures” section.
Over a complete business cycle (typically five to eight years), the Foundation’s overall annualized total return, after deducting for advisory, money management, and custodial fees, as well as total transaction costs, should perform above the median of the Morningstar Moderate Allocation fund universe and above a customized index comprised of market indices weighted by the strategic asset allocation of the Foundation.
Asset Allocation Constraints
The Committee believes that the Foundation’s risk and liquidity posture are, in large part, a function of the asset class mix. The Committee has reviewed the long-term performance characteristics of various asset classes, focusing on balancing the risks and rewards of market behavior. The following asset classes were selected:
- Domestic large capitalization equities
- Domestic mid capitalization equities
- Domestic small capitalization equities
- International equities
- Domestic fixed income
- International fixed income
- Cash/Cash equivalents
Based on the Foundation’s time horizon, risk tolerance, performance expectations, and asset class preferences, an efficient or optimal portfolio was identified. The strategic asset allocation of the Foundation is as follows:
Asset Allocation
Lower Strategic Upper Asset Class Limit Allocation Limit
Domestic large capitalization equities: Value 11% 13% 21% Core 7% 10% 17%
Domestic mid-capitalization equities Value 7% 12% 17% Core 1% 6% 11%
Domestic small capitalization equities: Growth 1% 5% 10%
Value 4% 9% 14% International equities 5% 15% 15% Fixed income:
Active Intermediate Duration 10% 15% 20% Treasury Inflation Protected 5% 10% 15% Active Intermediate International 1% 5% 10%
Rebalancing of Strategic Allocation
The percentage allocation to each asset class may vary as much as plus or minus 5 percent, depending on market conditions. Asset classes with 5 percent strategic allocation will have a lower limit of 1 percent.
When necessary and/or available, cash inflows/outflows will be deployed in a manner consistent with the strategic asset allocation of the Foundation. If there are no cash flows, the allocation of the Foundation will be reviewed quarterly.
If cash flows are insufficient to bring the Foundation within the strategic allocation ranges, the Committee will effect transactions to bring the strategic allocation within the threshold ranges of the strategic allocation.
Observed Behavior of Strategic Asset Allocation
January 1986 to June 2005 Geometric Standard N Positive N Negative Lowest Highest
Asset Allocation Policy Mean Deviation Periods Periods Return Return
Strategic Asset Allocation 11.07% 12.63% 54 19 -13.52% 15.19%
Downside Risk
Using Standard Deviation 1-Sigma 2-Sigma
Strategic Asset Allocation -1.56% -14.19%
* Note: High & Low quarterly returns, Periods are quarters, Geo Mean & Std Dev annual
Securities Guidelines
Every money manager selected to manage Foundation assets must adhere to these guidelines.
The following securities and transactions are not authorized unless receiving prior Committee approval:
- Letter stock and other unregistered securities, commodities or other commodity contracts, and short sales or margin transactions.
- Securities lending, pledging, or hypothecating securities
- Investments in equity securities for the purpose of exercising control of management
Domestic Equities
- Equity holdings in any one company should not exceed more than 10 percent of the market value of the Foundation’s equity portfolio placed with any portfolio manager
- Not more than 25 percent of the market value of the portfolio should be invested in any one economic sector (per portfolio manger)
- The manager shall emphasize quality in security selection and shall avoid risk of large loss though diversification
- The managers shall have discretion to invest a portion of the assets in cash reserves when they deem appropriate. However, the managers will be evaluated against peers on the performance or the total funds under their direct management
- Holdings of individual securities shall be large enough (round lots) for easy liquidation
Domestic Fixed Income
- Aggregate fixed income securities held in the portfolio shall have a Moody’s, Standard & Poor’s, and/or Fitch’s credit quality rating of no less than “BBB”. U.S. Treasury and U.S. Government agencies, which are unrated securities, are qualified for inclusion in the portfolio
- The exposure of the portfolio to any one issuer, other than securities of the U.S. Government or agencies, shall not exceed 10 percent of the market value of the fixed income portfolio
- Holdings of individual issues shall be large enough (round lots) for easy liquidation
- Aggregate portfolio duration for a manager will only vary plus or minus 25 percent of benchmark duration
International Equities
- Equity holdings in any one company should not exceed more than 10 percent of the market value of the Foundation’s equity portfolio placed with any portfolio manager
- Not more than 25 percent of the market value of the portfolio should be invested in any one economic sector (per portfolio manger)
- Allocations to any specific country shall not be excessive relative to a broadly diversified international equity manger peer group. It is expected that the non-U.S. equity portfolio will have no more than 40 percent in any one country
- The manager may enter into foreign exchange contracts on currency provided that use of such contracts is limited to hedging currency exposure existing within the manager’s portfolio. There shall be no direct foreign currency speculation or any related investment activity
- The manager shall emphasize quality in security selection and shall avoid risk of large loss though diversification
- The managers shall have discretion to invest a portion of the assets in cash reserves when they deem appropriate. However, the managers will be evaluated against peers on the performance or the total funds under their direct management
- Holdings of individual securities shall be large enough (round lots) for easy liquidation
International Fixed Income
- Allocations to any specific country shall not be excessive relative to a broadly diversified international fixed income manger peer group. It is expected that the non-U.S. fixed income portfolio will have no more than 40 percent in any one country
- The manager may enter into foreign exchange contracts on currency provided that use of such contracts is limited to defensive hedging currency exposure existing within the manager’s portfolio. There shall be no direct foreign currency speculation or any related investment activity.
- Defensive hedging is permitted, but no long-term hedging is anticipated to participate in the diversification benefits of currency rate fluctuations
- Aggregate fixed income securities held in the portfolio shall have a Moody’s, Standard & Poor’s, and/or Fitch’s credit quality rating of no less than “BBB”. Developed countries’ government securities and their agencies, which may be unrated securities, are qualified for inclusion in the portfolio
- The exposure of the portfolio to any one issuer, other than securities of the Developed countries’ government securities and their agencies, shall not exceed 10 percent of the market value of the fixed income portfolio
- Holdings of individual issues shall be large enough (round lots) for easy liquidation
- Aggregate portfolio duration for a manager will only vary plus or minus 25 percent of benchmark duration
Cash/Cash Equivalents
- Cash equivalents reserves shall consist of cash instruments having a quality rating of A-1, P-1, or higher. Eurodollar certificates of deposit, time deposits, and repurchase agreements are also acceptable investment vehicles
- Any idle cash not invested by the investment managers shall be invested daily through an
automatic interest-bearing sweep vehicle managed by the custodian
Selection of Money Managers
The Committee, with the assistance of the Consultant (if any), will select appropriate money managers to manage the Foundation’s assets. Managers must meet the following minimum criteria:
- Be a bank, insurance company, investment management company, or investment adviser as defined by the Securities and Exchange Commission’s (SEC) Registered Investment Advisers Act of 1940
- Provide historical quarterly performance numbers calculated on a time-weighted basis, based on a composite of all fully discretionary accounts of similar investment style, and reported net and gross of fees
- Composite index must be Level I -CFA Institute compliant (AIMR PPS/GIPS)
- Provide performance evaluation reports prepared by an objective third party that illustrate the risk/return profile of the manager relative to other managers of like investment style
- Provide detailed information on the history of the firm, key personnel, key clients (relative to privacy standards), fee schedule, and support personnel. This information can be a copy of a recent request for proposal (RFP) completed by the manager
- Clearly articulate the investment strategy that will be followed and document that the strategy has been successfully adhered to over time.
- Selected firms shall have no outstanding legal judgments or past judgments that may reflect negatively on the firm
Control Procedures Duties and Responsibilities of the Money Managers
The duties and responsibilities of each money manager retained by the Committee include:
- Manage the Foundation assets under its care, custody, and/or control in accordance with IPS objectives and guidelines set forth herein, and also expressed in separate written agreements when deviation is deemed prudent and desirable by the Committee
- Exercising investment discretion including holding cash equivalents as an alternative within the IPS objectives and guidelines set forth herein
- Promptly informing the Committee in writing regarding all significant and/or material matters and changes pertaining to the investment of Foundation assets, including, but not limited to:
- Investment strategy
- Portfolio structure
- Tactical approaches
- Ownership
- Organizational structure
- Financial condition
- Professional staff
- Recommendations for guideline changes
- All legal material and SEC and other regulatory agency proceedings affecting the firm
- Promptly voting all proxies and related actions in a manner consistent with the long-term interests and objectives of the Foundation set forth herein. Each manager shall keep detailed records of said voting of proxies and related actions and will comply with all regulatory obligations related thereto
- Utilize the same care, skill, prudence, and due diligence under the circumstances then prevailing that experienced, investment professionals acting in a like capacity and fully familiar with such matters would use in like activities for like foundations with like aims in accordance and compliance with all applicable laws, rules, and regulations from local state, federal, and international political entities as they pertain to fiduciary duties and responsibilities
- Acknowledge and agree in writing to their fiduciary responsibility to fully comply with the entire IPS set forth herein, and as modified in the future
Brokerage Policy
All transactions effected for the Foundation will be “subject to the best price and execution.” If a manager utilizes brokerage from the Foundation assets to effect soft dollar transactions, detailed records will be kept and communicated to the Committee in a timely period not to exceed a calendar quarterly reporting cycle
Performance Objectives
Investment performance will be reviewed at least annually to determine the continued feasibility of achieving the investment objectives and the appropriateness of the IPS for achieving the investment objectives and the appropriateness of the IPS for achieving those objectives.
It is not expected that the IPS will change frequently. In particular, short-term changes in the financial markets (1 to 2 years) should not require adjustments to the IPS.
Monitoring of Money Managers
Quarterly performance will be evaluated to test progress toward the attainment of longer-term targets. It is understood that there are likely to be short-term periods during which performance deviates from market indices. During such times, greater emphasis shall be placed on peer-performance comparisons with managers employing similar styles.
On a timely basis, but not less than four times a year, the Committee will meet to focus on:
- Manager’s adherence to the IPS guidelines
- Material changes in the manager’s organization, investment philosophy, and/or personnel
- Comparisons of the managers’ results to appropriate indices and peer groups, specifically:
- The risk associated with each manager’s portfolio, as measured by the variability of quarterly returns (standard deviation), should not exceed that of the benchmark index and the peer group without a corresponding increase in performance above the benchmark and peer group
| Asset Category | Index | Peer Group Universe |
|---|---|---|
| Domestic large capitalization equities: | ||
| Value | Russell 1000 Value | M* Large Value |
| Core | Russell 1000 | M* Large Blend |
| Domestic mid-capitalization equities | ||
| Value | Russell MidCap Value | M* Mid-Cap Value |
| Core | Russell MidCap | M* Mid-Cap Blend |
| Domestic small capitalization equities: | ||
| Growth | Russell 2000 Growth | M* Small Growth |
| Value | Russell 2000 Value | M* Small Value |
| International equities | MSCI-EAFE | M* Foreign Lg Blend |
| Fixed income: | ||
| Active Intermediate Duration | Lehman Aggregate | M* Interm Term Bond |
| Treasury Inflation Protected | Lehman LT Government | M* Long Government |
| Active Intermediate International | Citi-Non$ World Gov | M* World Bond |
In addition to the information covered during the quarterly reviews, the Committee will meet at least annually to focus on:
- The manager’s performance relative to managers of like investment style or strategy. Each manager is expected to perform in the upper half of the manager’s respective style universe
- The Foundation’s investment performance results compared to the overall composite performance figures to determine unaccounted for dispersion between the manager’s reported results and the Foundation’s actual results
The Committee is aware that the ongoing review and analysis of money managers is just as important as the due diligence implemented during the manager selection process. Accordingly, a thorough review and analysis of a money manger will be conducted if:
- A manager performs in the bottom quartile (75th percentile) of his or her peer group over a
quarterly or annual period - A manager falls in the southeast (low return / high risk) quadrant of the risk/return scattergram for the three-and/or five-year time periods
- A manager has a five-year risk adjusted return fall below that of the median manager within the appropriate peer group
Furthermore, performance that may require the replacement of a manager includes:
- A manager that consistently performs below the median (50th percentile) of his or her peer group over rolling three-year periods
- A manager that performs below the median (50th percentile) of his or her peer group over a five-year period
Major organizational changes also warrant immediate review of the manager, including:
- Change in key professionals
- Significant account losses
- Significant growth of new business
- Change in ownership
The performance of the Committee’s investment managers will be monitored on an ongoing basis, and it is at the Committee’s discretion to take corrective action by replacing a manager if they deem it appropriate at any time.
Disclosure Statement:
- Portions of this investment policy statement (IPS) taken from, “The Management of Investment Decisions”, by Trone, Allbright, Taylor.
- Portions of this IPS were developed by Breidenbach Capital Consulting, LLC (BCAP)
www.4bcap.com for the exclusive use of the Community Foundation of Southern Indiana. - BCAP retains all copyrights relative to its contributions herein and reserves the right to fully prosecute violations outside of the exclusive use for the Community Foundation of Southern Indiana.
- BCAP does not make formal assurances relative to the accuracy of information/data received from the Community Foundation of Southern Indiana or its retained vendors relative to the development of this IPS
Appendix – Allocation Background & Supplementary Data
Histogram: Quarterly Return Data -utilizing normal bell curve versus logarithmic.
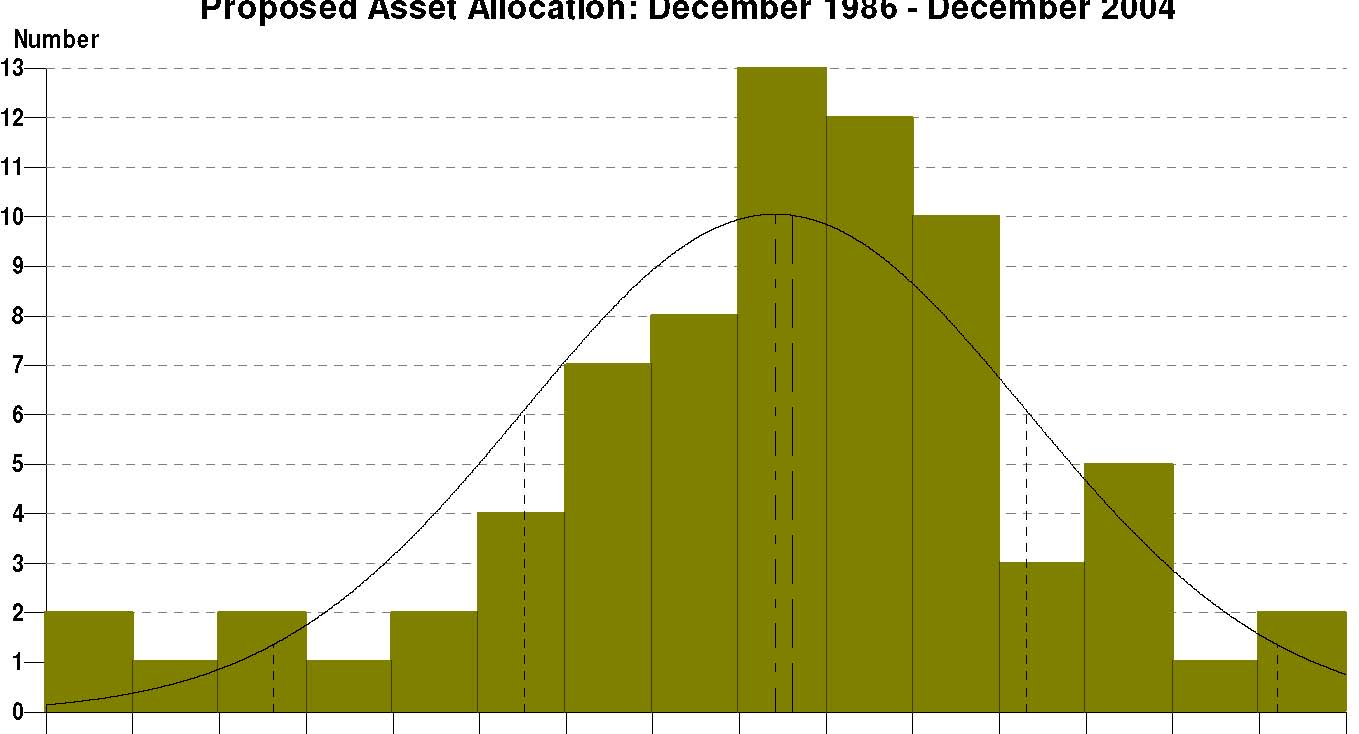
| -14.0% | -12.0% | -10.0% | -8.0% | -6.0% | -4.0% | -2.0% | 0.0% | 2.0% | 4.0% | 6.0% | 8.0% | 10.0% | 12.0% | 14.0% | 16.0% |
| Return | |||||||||||||||
| Mean | Median | Standard Deviations | |||||||||||||
Appendix – Allocation Background & Supplementary Data (continued)
Scatter plot: Quarterly Return Data – Rolling 3 Year Periods (The larger the plot the more recent the time period)
Rolling Risk vs. Return
Interval: 12 Quarters (Holding Period: Quarterly)
Return 6.0% 5.5% 5.0% 4.5% 4.0% 3.5% 3.0% 2.5% 2.0% 1.5% 1.0% 0.5% 0.0% -0.5% -1.0% -1.5% -2.0% 2.0% 2.4% 2.8% 3.2% 3.6% 4.0% 4.4% 4.8% 5.2% 5.6% 6.0% 6.4% 6.8% 7.2% 7.6% 8.0% 8.4% 9.0%
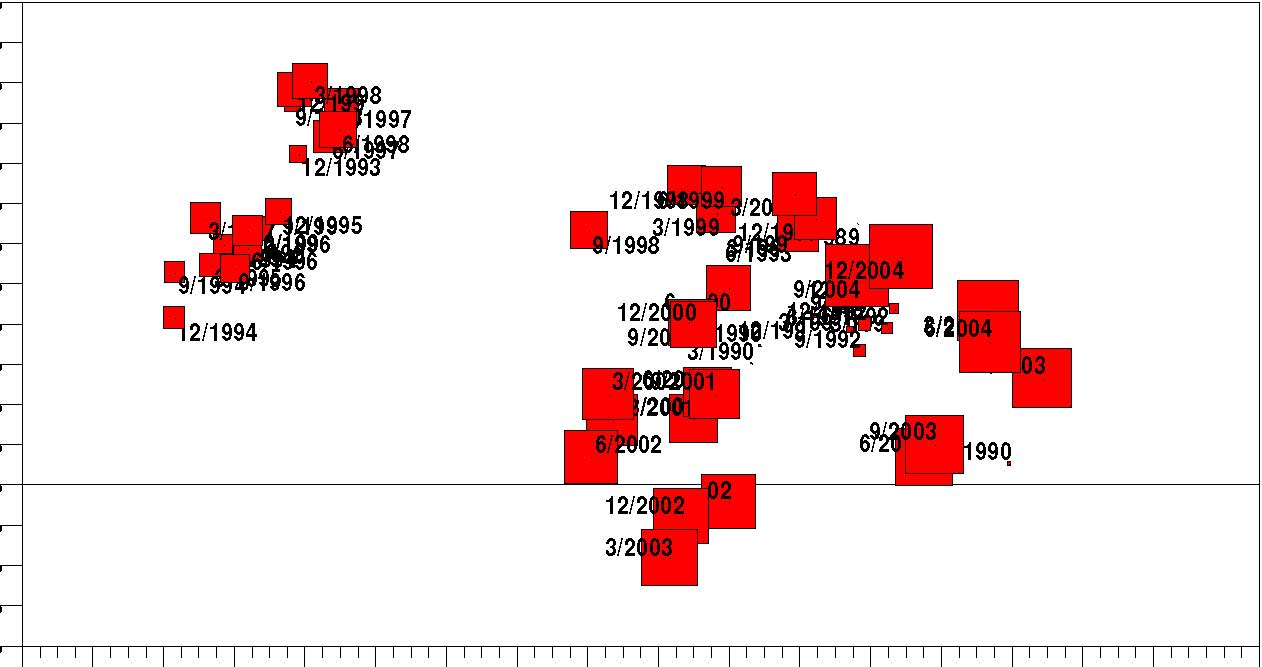
Risk (Std)
Appendix – Allocation Background & Supplementary Data (continued)
Scatter plot: Quarterly Return Data – Rolling 5 Year Periods (The larger the plot the more recent the time period)
Rolling Risk vs. Return
Interval: 20 Quarters (Holding Period: Quarterly)
Return
5.0%
4.5%
4.2%
3.9%
3.6%
3.3%
3.0%
2.7%
2.4%
2.1%
1.8%
1.5%
1.2%
0.9%
0.6%
0.3%
0.0%
2.0% 2.4% 2.8% 3.2% 3.6% 4.0% 4.4% 4.8% 5.2% 5.6% 6.0% 6.4% 6.8% 7.2% 7.6% 8.0%
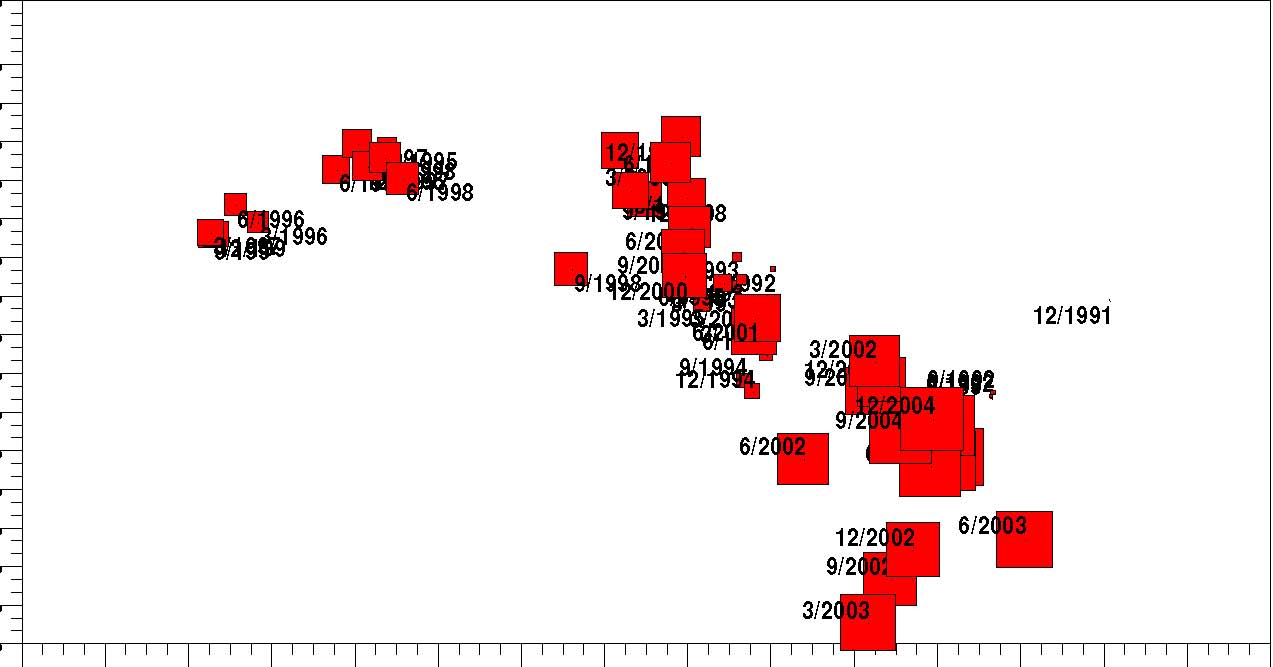
Risk (Std)
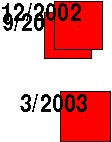
Appendix – Allocation Background & Supplementary Data (continued)
Scatter plot: Quarterly Return Data – Rolling 10 Year Periods (The larger the plot the more recent the time period)
Rolling Risk vs. Return Interval: 40 Quarters (Holding Period: Quarterly)
Return
3.6% 3.5% 3.4%
![]() 9/2000
9/2000
3.3%
12/19912/2000 3/1998![]() 3.2%
3.2%
12/1998 3.0% 6/1999
6/1998 3/20
3.1%
6/2000 2.9%
3/1999
![]()
![]() 6/2001
6/2001 ![]() 9/1998 12/1999
9/1998 12/1999
12/1996
9/1997 2.8%
3/2001 6/199 ![]()
![]() 3/2002 9/1999 122001 6 2.7%
3/2002 9/1999 122001 6 2.7%
2.6%
6/2002 3/1997 2.5% 2.4% 2.3% ![]() 6/
6/
2.2% 2.1% 2.0% 1.9% 1.8%

4.3% 4.4% 4.5% 4.6% 4.7% 4.8% 4.9% 5.0% 5.1% 5.2% 5.3% 5.4% 5.5% 5.6% 5.7% 5.8% 5.9% 6.0% Risk (Std)
Appendix – Allocation Background & Supplementary Data (continued)
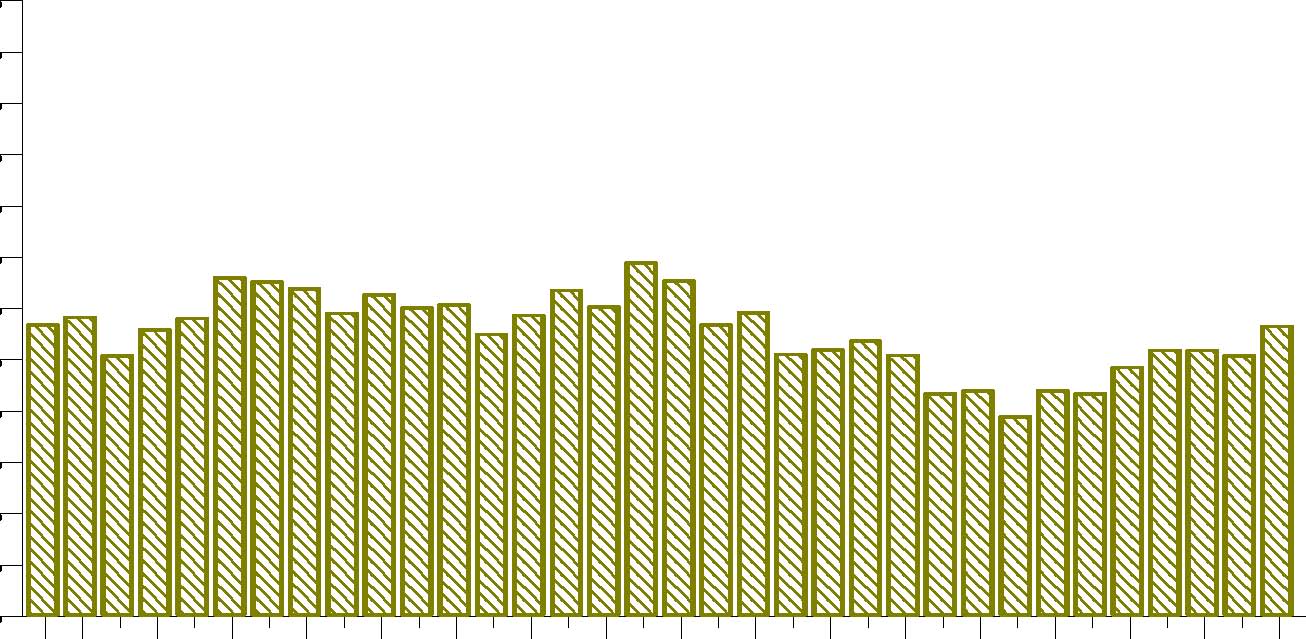
Rolling Bar Chart: Quarterly Return Data – Rolling 10 Year Periods
Rolling Bar Graph
Interval: 40 Quarters (Holding Period: Quarterly)
Return Values 6.0% 5.5% 5.0% 4.5% 4.0% 3.5% 3.0% 2.5% 2.0% 1.5% 1.0% 0.5% 0.0% Sep Jun Dec Jun Dec Jun Dec Jun Dec Jun Dec Jun Dec Jun Dec Jun Dec 1996 1997 1997 1998 1998 1999 1999 2000 2000 2001 2001 2002 2002 2003 2003 2004 2004 Interval: 40 Proposed Asset Allocation
Appendix –
Sample portfolio manager appointment/acceptance letter.
_____________________ (the Portfolio Manager) hereby acknowledges receipt of the Investment Policy Statement for the Community Foundation of Southern Indiana (the Client). Client appoints Portfolio Manager of Client’s designated account and Portfolio Manager accepts such appointment.
Portfolio Manager agrees to manage the investment reinvestment of Client’s account assets in accordance with the investment objectives and guidelines set forth in Client’s Investment Policy Statement, receipt of which is hereby acknowledged.
Client is a community foundation under the laws of Indiana. Portfolio manager acknowledges that it is a fiduciary with respect to Client. No other fiduciary of Client shall be liable for the acts or omission of the Portfolio Manager or be under any obligation to invest or otherwise manage any of Client’s assets that are subject to the management of the undersigned Portfolio Manager.
Client acknowledges that it has received a current copy of the Portfolio Manager’s Form ADV Part II
| __(asset manager name here)__ | Community Foundation of Southern Indiana |
| Signature:________________________ | Signature:_____________________ |
| Name:___________________________ | Name:________________________ |
| Title:____________________________ | Title:_________________________ |
| Date:____________________________ | Date:_________________________ |