|
Post Seismic Deformation of Andaman Islands using GPS |
John Paul1,
Roger Bilham2, Tony Lowry3, R. Smalley1, C.P. Rajendran4
This project has been funded by National Science Foundation
|
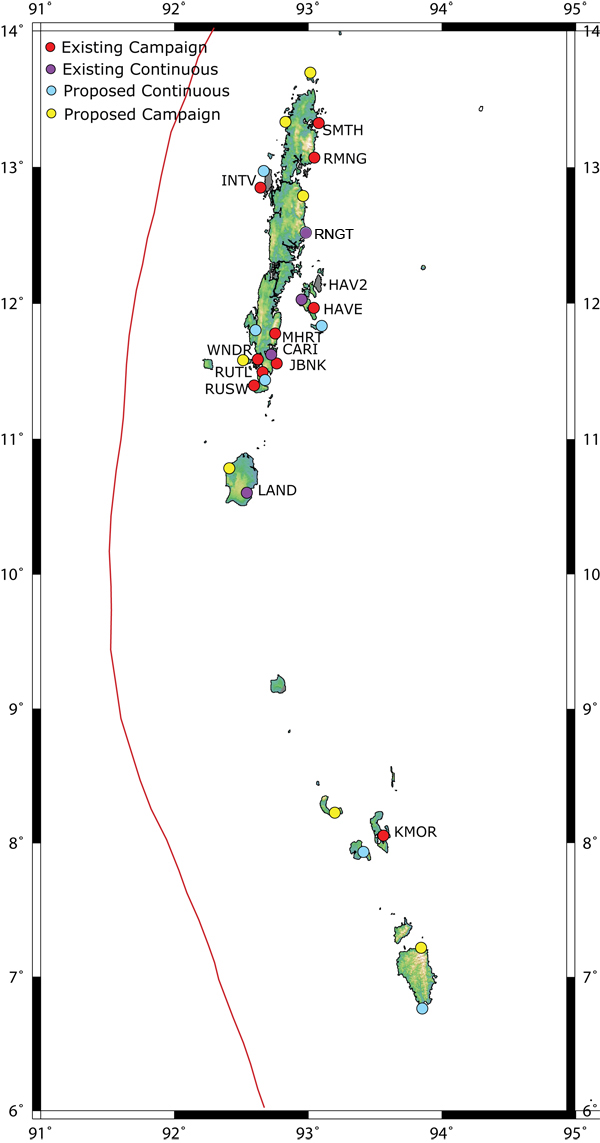
On 26 December 2004 the Andaman Islands near Port Blair, on the hanging wall of the Sumatra/Andaman mega thrust, sank 86 cm and shifted 3.1 m WSW. Port Blair since then has continued to move WSW at an exponentially decaying rate that by mid 2006 had attained 25 cm (i.e. 8% of coseismic slip). In contrast the harbour rose 15 cm, an 18% reversal in coseismic subsidence. We have installed ten additional GPS points since the earthquake (http://www.ceri.memphis.edu/people/jpuchkyl/) and these too show post seismic slip, but with spatial variations that require variations in the subsurface process along strike, in addition to downdip post-seismic adjustment processes. The coseismic hinge-line separating uplift from subsidence in the southern Andaman Islands appears to have shifted to the east by 10-20 km. We note that vertical movements in the islands in the past 150 years have been quite complex but are known largely from eyewitness descriptions in many cases, even including the 2004 earthquake. For example, war-time coastal bunkers constructed shortly after the 1941 Andaman earthquake on a raised wave-cut marine terrace had been partly submerged prior to 2004, and then incremented ≈80 cm lower in the 2004 event. This has led us to install a series of tidal bench marks linked to GPS measurements so that future investigations will be able to quantify these changes better. Pressure gauges linked via leveling to GPS control points define mean sea level at 2-3 points every 5 minutes, while secondary points using hydraulic averaging are surveyed along the coast during their operation. We are currently in the process of modeling these GPS measurements, both as viscoelastic relaxation in response to the coseismic strain change and postseismic slip on the plate boundary interface down-dip of the seismic rupture. Previous studies elsewhere suggest that using both the horizontal and vertical displacements enables the models to distinguish the relative importance of these two processes. Figure 1 shows the GPS sites installed all across the islands. Most of the campaign sites were measured thrice in last 2 years the first measurements being in second week of Jan 2005. Continuous sites CARI was operational from Jan 20, 2005 while HAV2 in Havelock has been operational from May 2006. Meteorological parameters like atmospheric pressure, temperature and relative humidity are being measured at these two locations. |
|
|||||||||||||||||||||||||||||||||||||||||||||||||||||||||||||||||||||
|
Figure 1 |
||||||||||||||||||||||||||||||||||||||||||||||||||||||||||||||||||||||
|
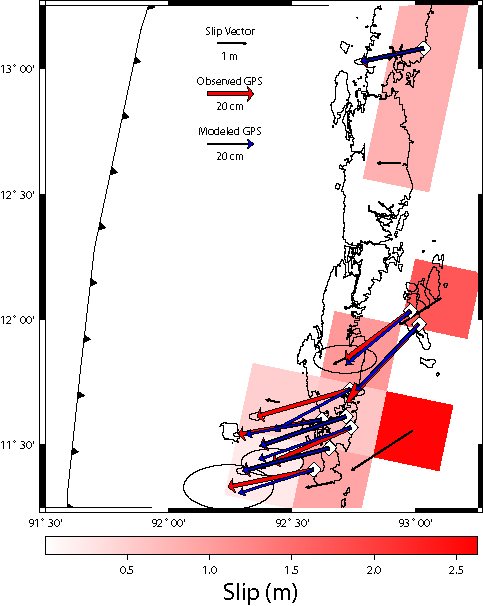
Initial modeling results from the modeling suggest a best-fit model of postseismic slip from the Andaman Island GPS data. In Figure 2, the red vectors are the total displacement predicted by fitting an exponential decay to the data, using initiation time T0 = the time of the 2004] Sumatra/Andaman Great Earthquake and decay time τ = 0.746 years from parameter grid search. Ellipses are Chi-square scaled 95% uncertainties on |
||||||||||||||||||||||||||||||||||||||||||||||||||||||||||||||||||||||
|
Figure 2 |
||||||||||||||||||||||||||||||||||||||||||||||||||||||||||||||||||||||
|
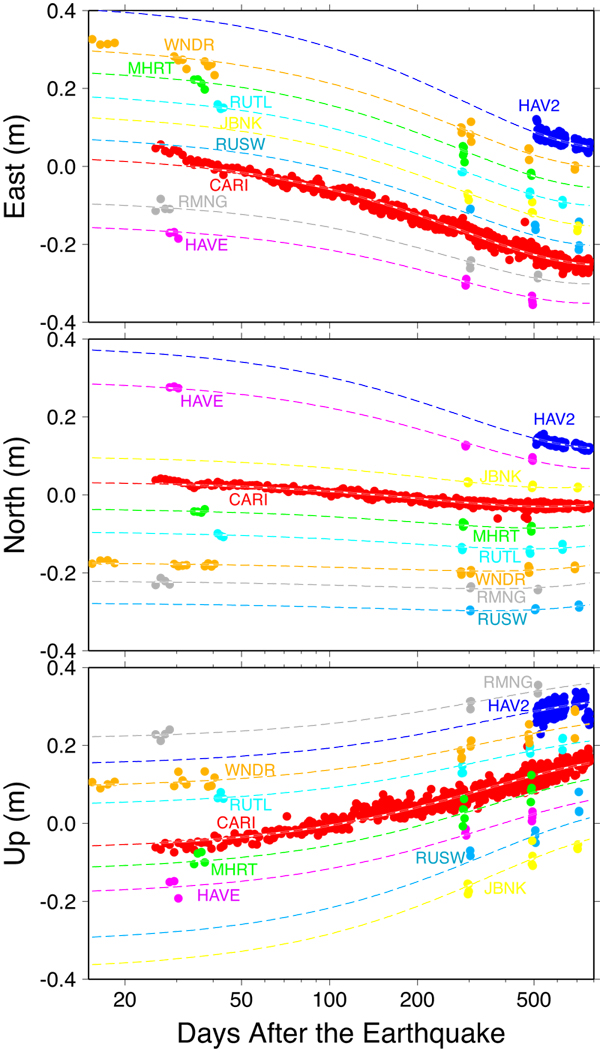
the pre-exponential constant displacement terms; note that in actuality the predicted total displacement shown is only 90% completed after 1.77 years. Blue vectors are displacements from a best-fit model of postseismic slip on the Andaman megathrust. The plate interface was discretized with a 30 km mesh and slip was assumed to have the same exponential decay parameters (T0 = 2004.984; τ = 0.746 years) as the exponentials fit to the GPS data. Estimates of dip-slip and strike-slip are indicated by color (white to red corresponding to magnitude of slip) in each discretized segment of the plate interface, and by black slip vectors (projected to the Earth's surface). Figure 3 shows red circles that are daily estimates of GPS position at station CARI, with scaled one-sigma uncertainties indicated by the cyan bars. Dark blue line is deformation predicted by a model of postseismic slip on the plate interface, described in more detail in Figure 2. |
||||||||||||||||||||||||||||||||||||||||||||||||||||||||||||||||||||||
|
Figure 3 |
||||||||||||||||||||||||||||||||||||||||||||||||||||||||||||||||||||||
|
Figure 4 |
||||||||||||||||||||||||||||||||||||||||||||||||||||||||||||||||||||||
|
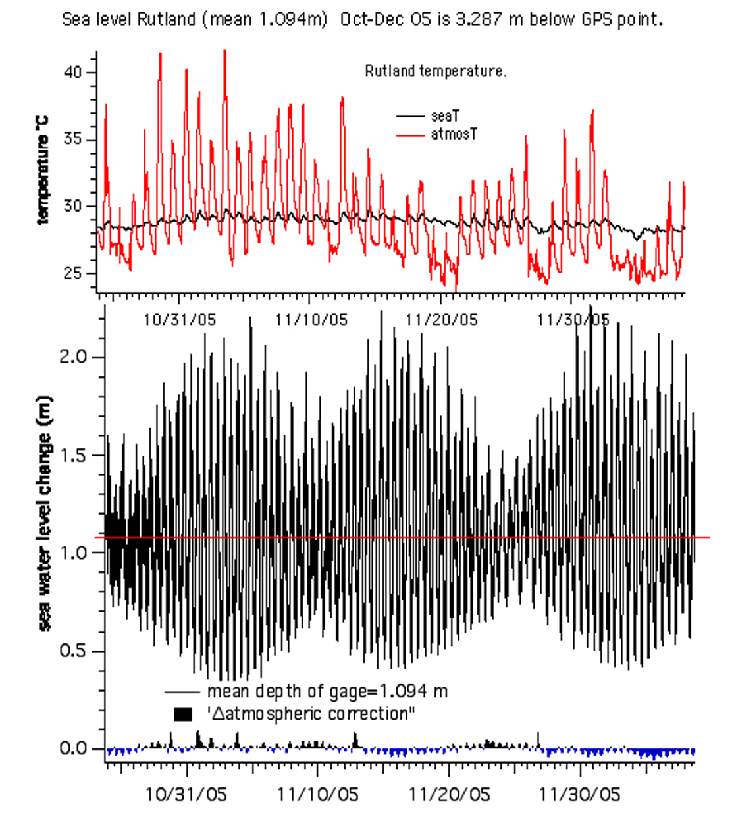
Pressure gauges were used to make sea level measurements with respect to a GPS point. Figure 4 shows the sea level at Rutland was 3.287 below the GPS point during Nov 2005. More measurements were taken at other location in Andaman Islands to make sea level measurements. |
||||||||||||||||||||||||||||||||||||||||||||||||||||||||||||||||||||||
|
||||||||||||||||||||||||||||||||||||||||||||||||||||||||||||||||||||||
|
100 yr old jail that stood firm during 2004 earthquake(Movie) |
1University
of Memphis, TN,
2University of Colorado,CO, 3Utah
State University, UT, 4
Center for Earth Sciences, IISC, Bangalore