Example #4: Topography and structure as a regional strain marker
The measurement of regional strain can be tricky, mainly because there are very few markers that straddle the entire region over a long enough time to be useful. Geodetic methods measure displacements of points at a time scale approaching a decade, and both the spatial and temporal limitations lead to difficulties in interpretation. One of the best strain markers may be the topography (of both the ground surface and older surfaces).
As with all methods, there are a number of assumptions that must be made and limitations to be acknowledged. In this case, we will assume the following:
1. Topography of both the ground surface and the recent structural topography (e.g., basin floors) is generated to a first order by displacements across crustal scale faults in the upper crust and that the source of energy is uniformly distributed.
2. The regional strain is to first order homogeneous.
3. Long-term patterns of deformation are generated by the "freezing in" of short-term infinitesimal strains, of the sort that 3d~def can model.
If these assumptions are satisfactory, then we can use 3d~def to calculate the interdependence of and displacements across a series of faults that can be shown to have been active over the last several hundred kyr or My. Obviously, the further back in time we try to apply this method, the worse the approximation gets.
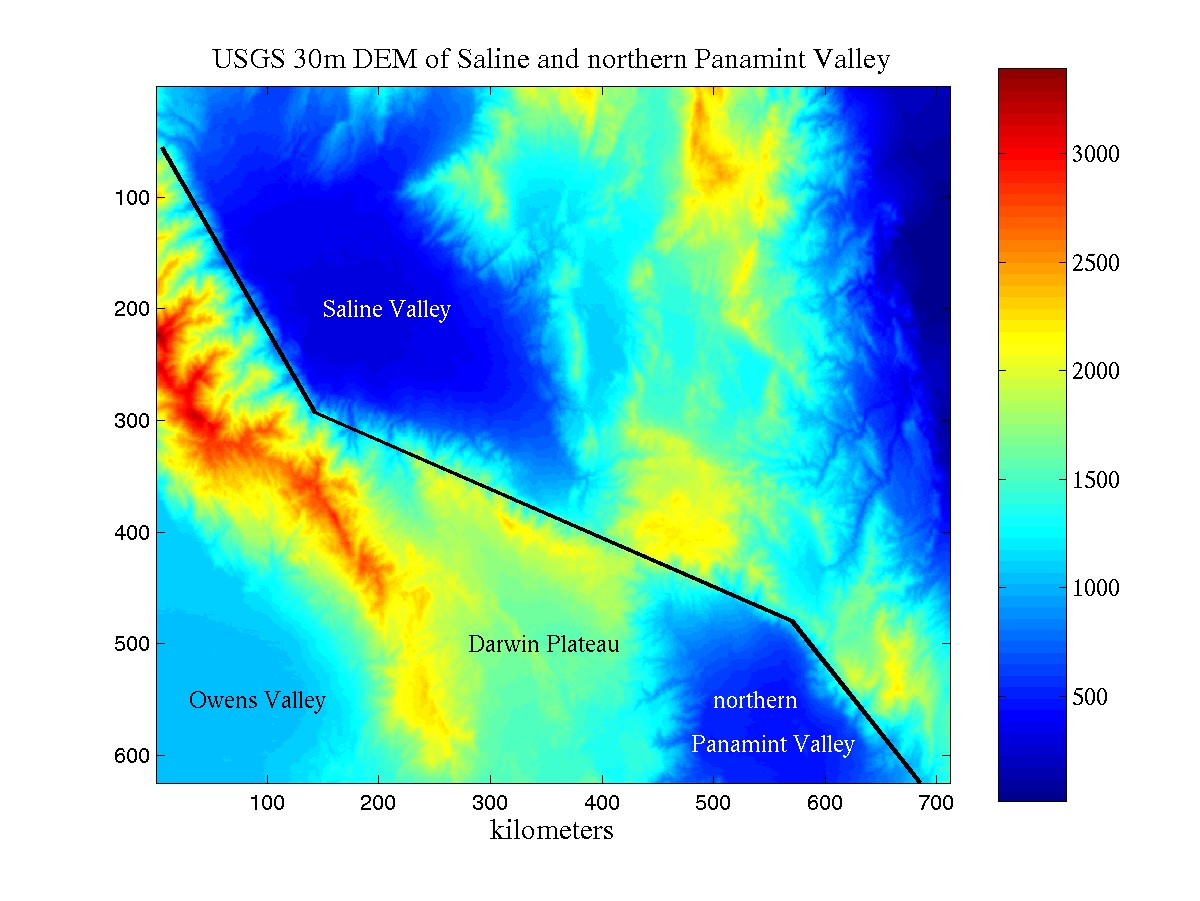
Here we show an example of part of the southwest Basin and Range province, the Saline Valley - Panamint Valley linked fault system. The figure below shows the topography.
USGS DEM of Saline Valley and northern Panamint Valley
Saline Valley is one of the deepest enclosed holes in the country, and is bordered to the west by the fault bounded Inyo Range and to the south by basalts of the Darwin Plateau and granitoids of Hunter Mountain. A single pass connects Saline Valley to Panamint Valley, and the two valleys are joined by the Hunter Mountain (predominantly) strike-slip fault (HMF). The HMF connects to the eastern side of north Panamint Valley, where the fault continues southeast along the edge of the Panamint block.
For this example (and it is only an example of the utility of 3d~def), we shall ignore the faults within the Darwin Plateau and along the western boundary of the Inyos.
An example of the input file can be obtained here. Click on the thumbnail image below to see more details.
Saline Valley is predicted very well in most of these models, certainly ones in which the maximum strain (or stretch) is toward the west or northwest. This means that Saline Valley is not a good regional strain discriminator. Because Saline Valley is such a dominant feature, both in the models and in reality, it overwhelms the scaling of elevations, which means that we don't get to see much of the detail in northern Panamint Valley. (This is again true in reality, since northern Panamint Valley offes a very different drama to the visitor than does the gaping hole of Saline Valley.)
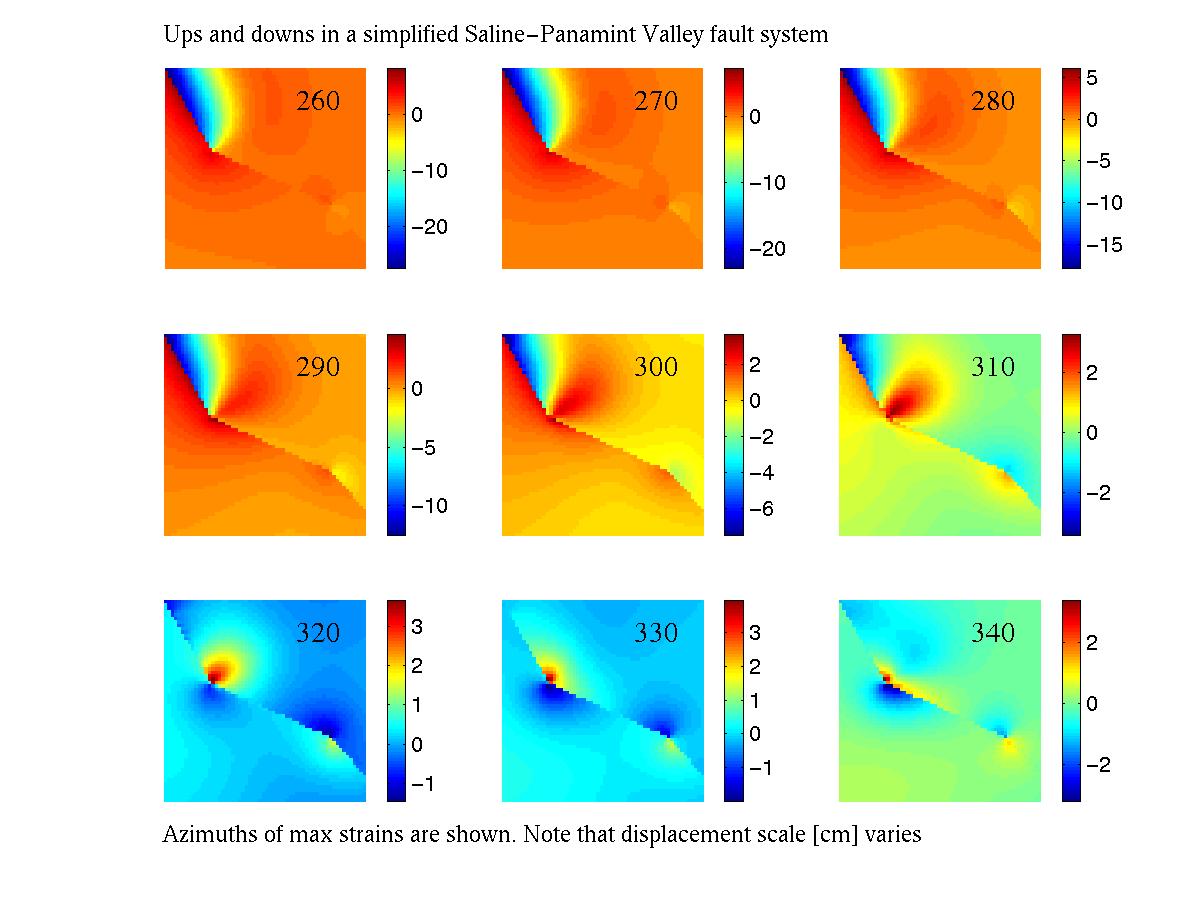
The figure below shows thumbnail sketches of the southern part of the modeled region, that is, northern Panamint Valley. To see more details, follow the link.
These figures show quite a different picture. If we go with the assumption that northern Panamint Valley is an actively subsiding basin (and there is some reason to doubt that) and that the topography generally reflects the current ups and downs of the region, then the maximum strain must be oriented between 260 - 290 degrees.
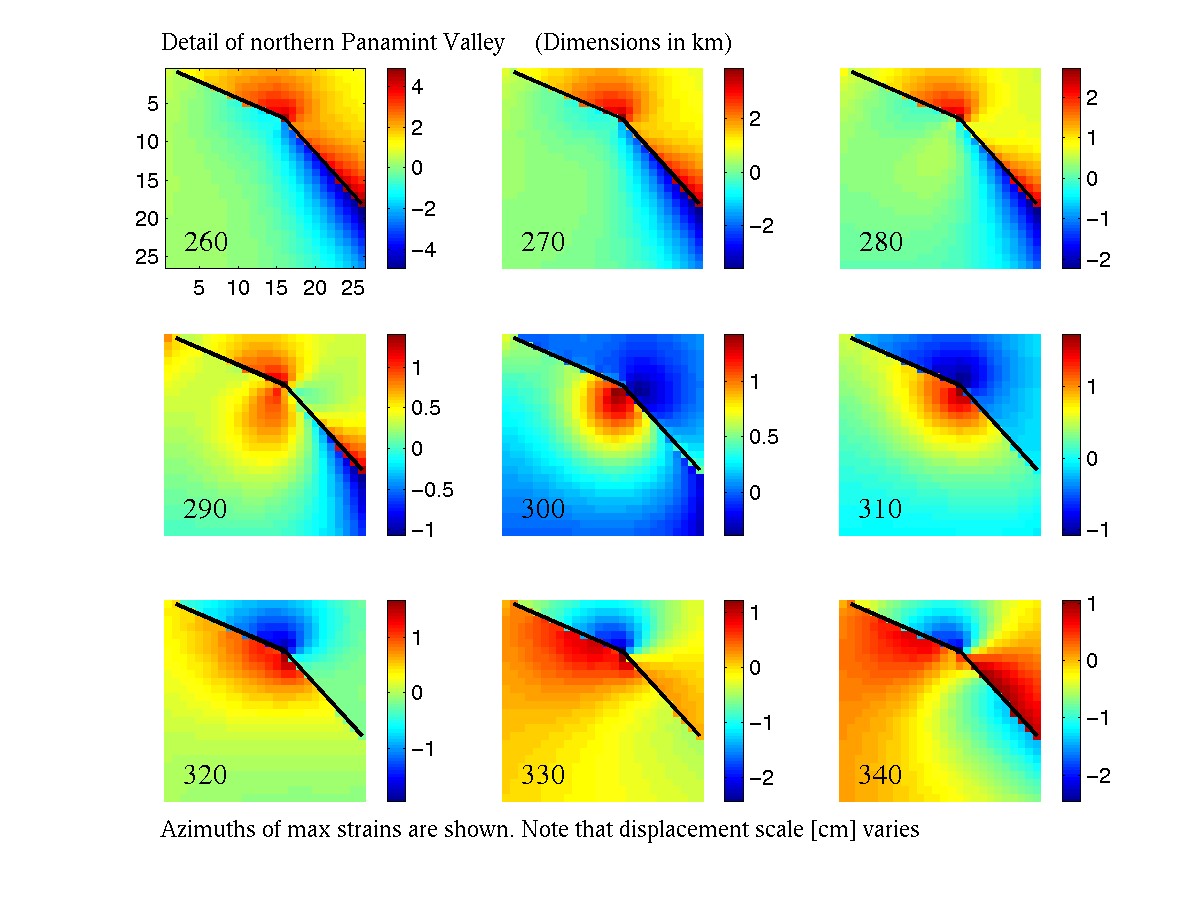
The figures below show more detail still from model #3 (max strain toward 280), in which the model succesfully predicts a topographic low (i.e. a pass) between Panamint Butte and Hunter Mountain, each to the northeast of the faults. Whether this pass is tectonically controlled (as the model predicts) or not is unknown, as far as I know, at least.
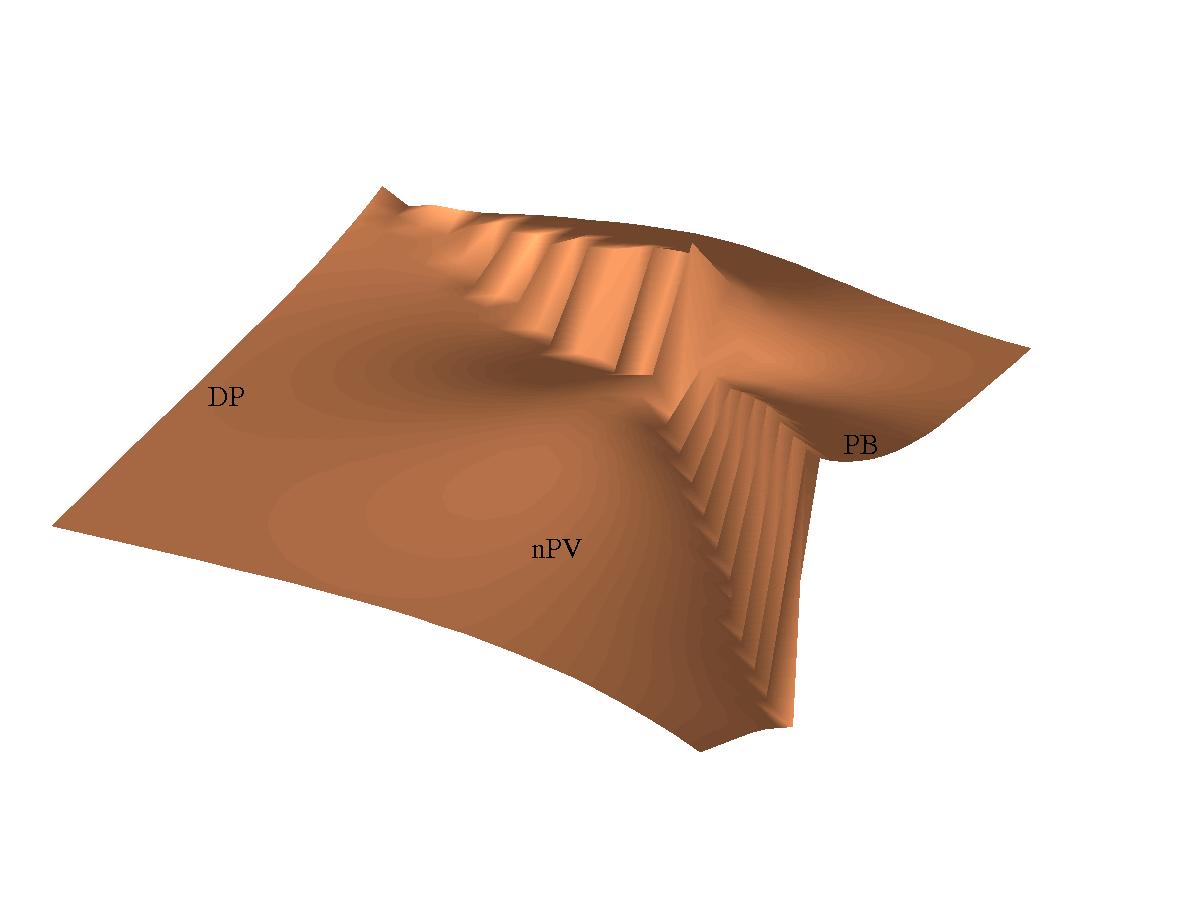
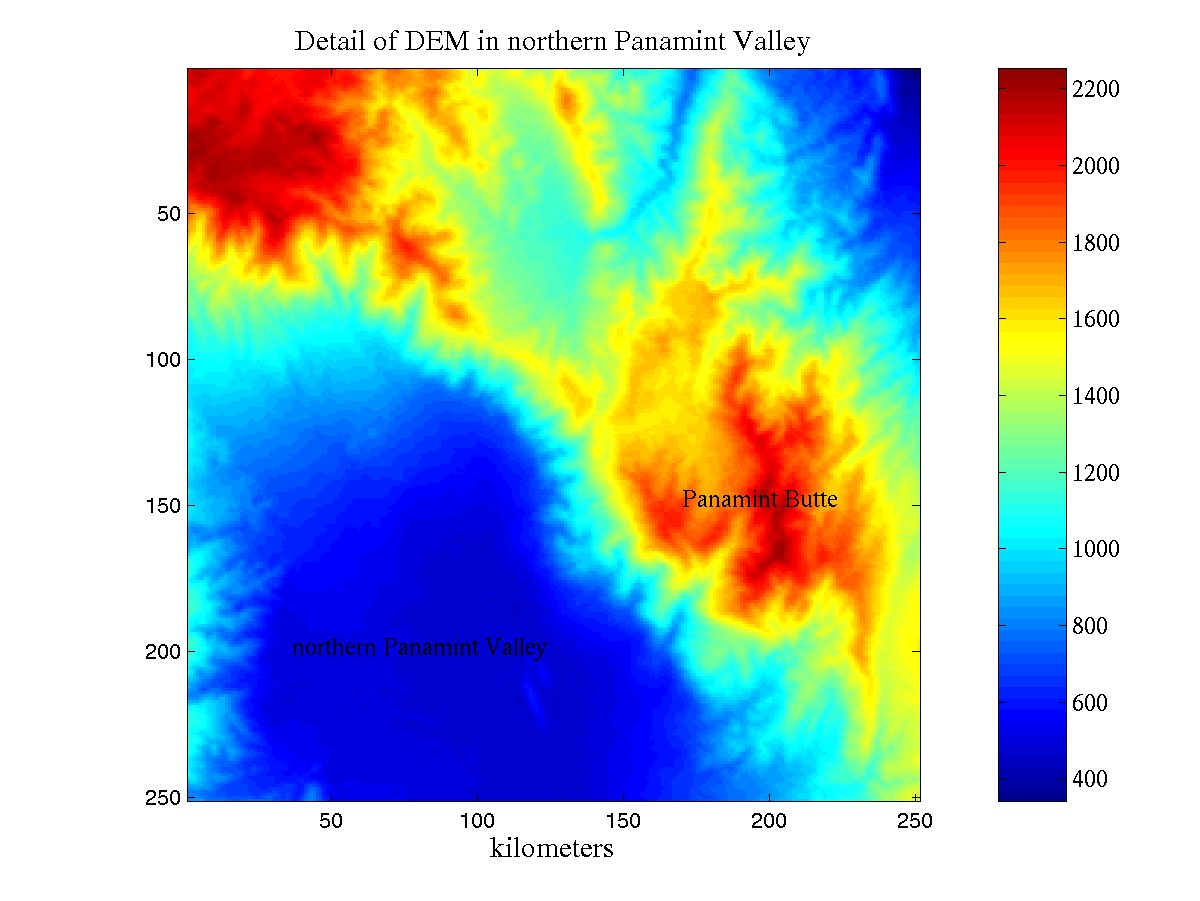
On the left is a perspective view looking toward the north - northeast over the floor of northern Panamint Valley. The model-fault runs from the bottom-right to top-left; it's corrugation reflects the discretization of the elements. On the right is the USGS 30m DEM of roughly the same area.
And the lesson to be learned is: the models appear to successfully predict the topography to a first order using relatively few faults. If the assumptions discussed at the beginning are valid, then the numerical experiments (which is how these models should be viewed) provide us with a regionally averaged strain field in which the maximum extension lies somewhere between 260 and 300 degrees. We are also left with the predictions that a) northern Panamint Valley is far less of a sedimentary basin than is Saline Valley (which is by all accounts true), b) that the (Cottonwood) pass, to the northwest of Panamint Butte, is tectonically controlled, and c) that the currently active fault in northern Panamint Valley is predominantly strike-slip (we've not shown evidence for that here, but nonetheless it is predicted).
There is more to the Saline Valley - Panamint Valley story than we've described here, so please don't take these results as gospel. Yet.