Example #5: Rupture scenarios of the New Madrid earthquakes of 1811-1812
In a continuing effort to understand three of the largest earthquakes to strike the lower 48 in historical times (1811-1812, 3 M 7.8-8.1, New Madrid, central USA), we have set up some numerical experiments using 3d~def to examine likely rupture scenarios.
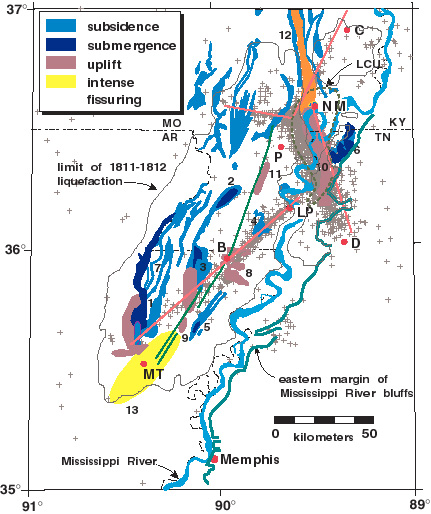
We use as first-order evidence the accumulated historical observations of uplift, subsidence, and fissuring that occurred during and immediately after the three earthquakes. Much of the observational evidence comes from the first official survey by the U. S. G. S., published in 1910, by Fuller. A summary of Fuller's evidence and other geomorphic features is shown below:
Likely faults are shown as straight line segments. The seismicity pattern outlines a classic left-step in a NE-oriented dextral strike-slip system. Within the resultant compressional step is our local "mountain", Lake County Uplift, which has a relief of up to 10 m. In the Mississippi floodplain, 10 m is nothing to be sneezed at.
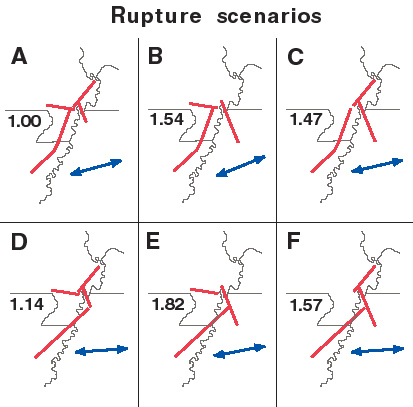
Likely rupture scenarios are shown below:
Numerical Procedure.
The models shown below use the abilities of 3d~def in a slightly different way than have previous examples. The experimental procedure is this:
1. An initially uniform driving force is derived: The driving force for each scenario was assumed to be regionally uniform and was derived from a moment-tensor summing of the scenario shown in each panel: the arrows show the direction of maximum compression, and the numbers show the relative magnitude of maximum shear strain in each regional strain tensor (normalized to the minimum value in panel A). Thus, all else being equal, we might expect the scenario in A to be preferred, since as strain accumulates, it is this level of shear strain that is reached first.
2. Rupture is permitted only on the first-chosen fault segment, the dimensions of which are enlarged or reduced in order to generate the "correct" magnitude earthquake (assuming Mo = r.A.u, where r is rigidity, A is rupture area, and u is average displacement).
3. The result of step 2 is that the regional strain field is reduced and reduced inhomogeneously. To simulate this for the second earthquake, the result of the first earthquake is placed back into the model and now aids in driving that first fault segment. This then adds and subtracts appropriately from the regional strain field and in sum drives the second and subsequent ruptures.
4. After each earthquake, as well as calculating surface vertical displacements (see figures below), we evaluated if the net strain field was consistent with static stress triggering of subsequent events. In each case, postive triggering appeared consistent, although we do not show the appropriate figures here.
For various other reasons, we placed the first main shock on the southern arm of seismicity, but bent it off of the seismicity and onto the Bootheel lineament. This generates the uplift/subsidence pattern seen below:
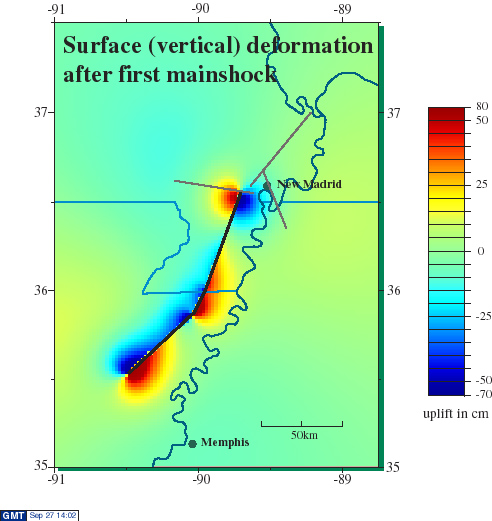
(Note that the scale is not linear.)
This produces a pattern that is a fairly good fit to the observations, particularly the thin zone of uplift to the east of the Bootheel lineament and in the vicinity of the fault bend.
We next placed the principal aftershock on the remainder of the southern arm of seismicity, which produced this cumulative pattern of vertical deformation:
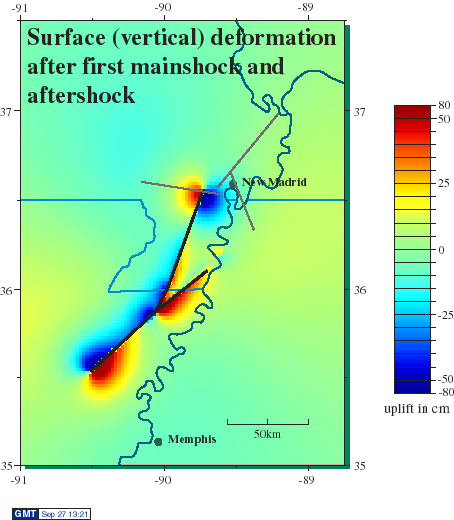
This hightlights the thin zone of uplift to the east of the Bootheel lineament, which is precisely what is observed, and it provides a small region of relative subsidence between the main rupture and the aftershock rupture. It is here that historic lake Cagel (since drained) formed shortly after the two earthquakes.
We next placed the second mainshock on the northern arm of seismicity and the third mainshock on the thrust and vertical fault that extends the thrust to the west. The final pattern of vertical deformation looks like this:
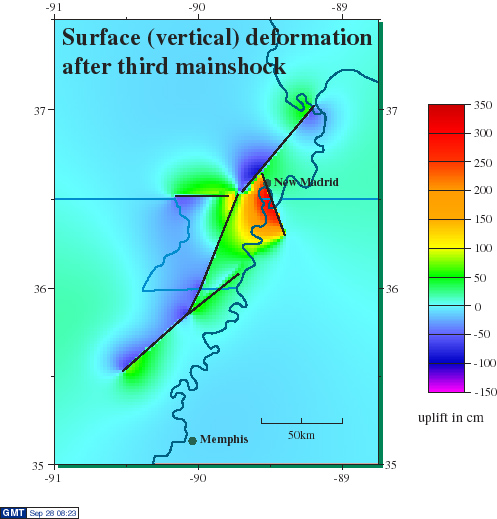
This pattern of uplift and subsidence is remarkably close to the obervations in the top figure, although we are currently examining more geomorphic evidence for rupture extension of the central thrust toward the southeast rather than toward the west.
Forward models of this type are of course not unique in any sense of the word, but they do provide impetus for directed field work, and they do allow for a check on realms of possibility, and - as always - tempered with restraint, they are excellent pedagogic tools.
 These
figures and text are preliminary. Please respect the rights of the
owner (M. Ellis) and do not use for purposes other than teaching the
use of 3d~def. Thanks.
These
figures and text are preliminary. Please respect the rights of the
owner (M. Ellis) and do not use for purposes other than teaching the
use of 3d~def. Thanks.